
Insights
Data and Graphs: Analyzing and Visualizing Information in Elementary Math
Have you heard the term “data literacy?” It is the ability to read, understand, create, and communicate data as information. It involves understanding how data is gathered, processed, analyzed, and presented in a way that allows individuals to make informed decisions based on the data. Data literacy also includes the ability to critically evaluate data and its sources, as well as the skills to interpret and communicate data effectively. It is an essential skill in today’s data-driven world.
A key element within data literacy is graphing. It is an important part of elementary math for a variety of reasons. It can spark student interest and excitement in mathematics. Graphs can be utilized across different subjects and with real-world examples, demonstrating the practical relevance of mathematical skills and concepts. Graphs enable students to visually represent, compare, analyze, and discuss data. Techniques for collecting and analyzing data include tallying, counting, surveying, sorting, and making graphs with both numerical data and tangible objects.
Here are some tips for teaching about data and graphs to your elementary students:
1. Start with the basics: Introduce students to the concept of data and graphs by explaining that data is information that can be organized and represented visually through graphs. The main types of graphs and their uses found in elementary curricula are:
- Tally chart: used to record data
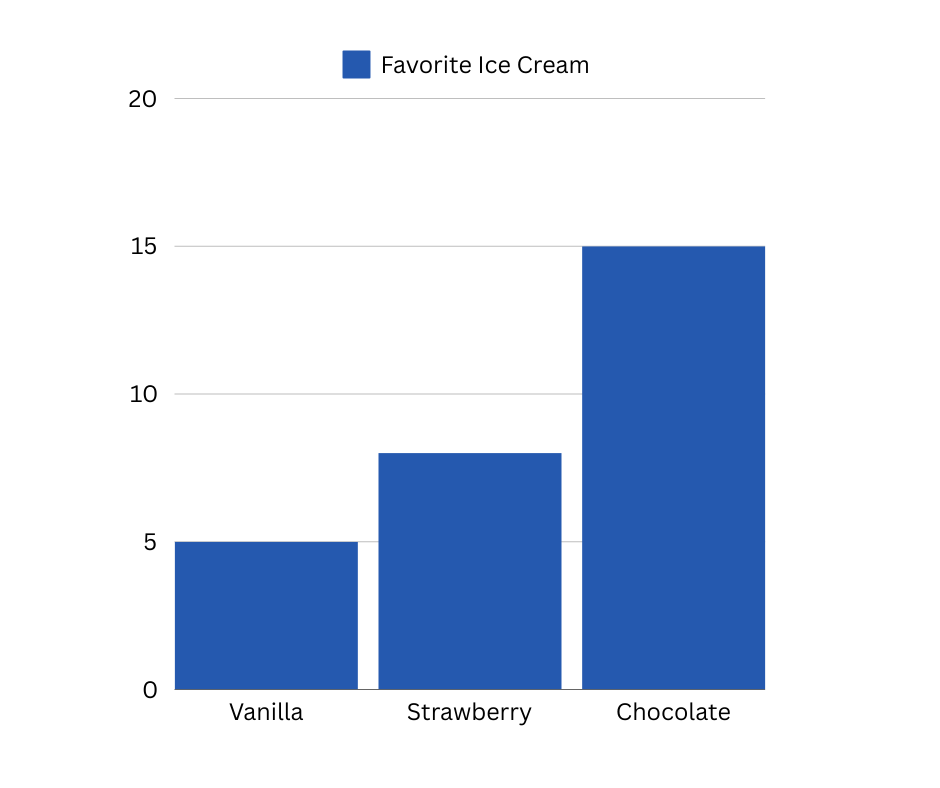
- Bar Graph: used to show comparisons
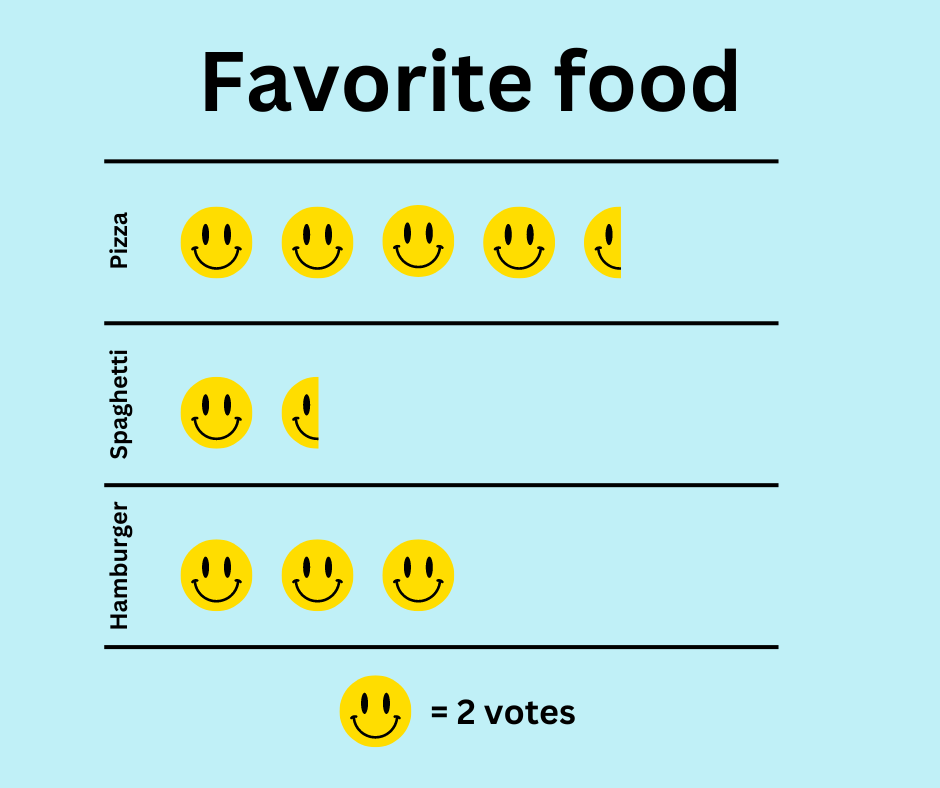
- Picto/Picture Graph: shows comparisons by using pictures or symbols to represent data
- Line Graph: used to track changes over time
- Line/Dot Plot: shows frequency on a number line
Important reminders to students when creating graphs:
- Be neat! Use graph paper or a ruler to create straight lines so data can be easily compared.
- Be consistent in the size and spacing of data on the graphs. For pictographs, be sure that the pictures can be easily duplicated and shown as a half image if needed.
- Include all components of the graph such as titles, labels, keys/legends, units, x-axis, and y-axis. One way for students to remember the direction of the x-axis versus the y-axis (besides horizontal and vertical) is that you raise your hand to ask “why” just like the y-axis goes up.
2. Use visual aids: Use charts, diagrams, and pictures to help students understand the different types of graphs and how to interpret them. Also, show students examples of poorly designed graphs as well as good ones so they can identify the importance of the various elements in a graph.
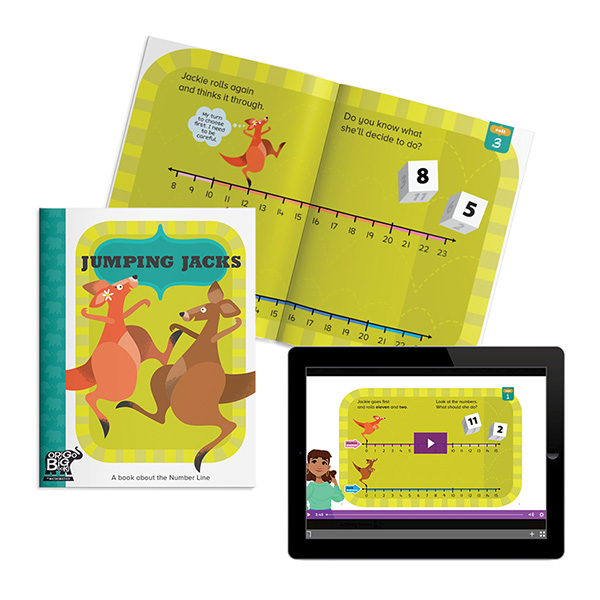
3. Use real-life examples: Show students how data and graphs are used in everyday life, such as tracking the weather or keeping track of how many books they read each month. One way to present real-life examples and uses for graphs is through literature, like in our ORIGO Animated Big Books and these other titles:
- Lemonade for Sale by Stuart J. Murphy
- The Great Graph Contest by Loreen Leedy
- Tally O’Malley by Stuart J. Murphy
- Family Reunion by Bonnie Bader
- Tiger Math: Learning to Graph from a Baby Tiger by Ann Whitehead Nagda
4. Begin with basic questions when interpreting data from a graph:
- What type of graph is it? (pictograph, bar graph, line graph, etc.)
- What does the title tell you about the information in the graph?
- What are the labels on each axis?
- What are the units for the scales?
- What does the key represent?
- Which item has the most/least?
- Which item has more/less than ___?
- Which items have the same?
- How many items were there in all?
- How many more ___ than ___?
5. Encourage critical thinking: Ask students to analyze the data and graphs they are presented with, and to draw conclusions based on the information they see. Use data visualizations, such as those offered in the Data Talks Archives – YouCubed, to spark observations and discussions.
Ideas for critical thinking questions:
- What does the graph tell us?
- What does the graph not tell us?
- How can the scale on a graph affect the way data is interpreted?
- What can you learn from looking at a bar graph versus a line graph?
- How can you tell if a graph is misleading or inaccurate?
- What are some common mistakes people make when creating graphs?
6. Connect to other subject areas: Show students how data and graphs are used in other subject areas, such as science, social studies, art, PE, etc. This can help them see the practical applications of these concepts outside of math class. If possible, have them create graphs related to data from other subjects to make a deeper connection between the subject areas.
7. Make it interactive: Have students collect their own data by conducting surveys or polls in the classroom, around school, or at home. This hands-on approach allows them to see firsthand how data can be gathered and represented in graphs. They can gather data from a variety of sources such as:
- Spinners or dice with pictures, shapes, colors, numbers, etc
- Handful of colored candy or trail mix
- Track weather or temperatures
- Have students conduct surveys about various topics:
- Favorite color
- Favorite ice cream
- Favorite food
- Favorite book genre
- Favorite kind of animal
- Favorite recess activity
- Favorite school subject
- Favorite season
- What do you do first after school
- What time do you wake up
- Vacation spot
- Way to travel
- Sport
- Hobby
- Number of letters in name
- Number of family members
- Pets
- Eye color
- Shirt color
8. Create graphs with various items: Graphs do not have to be created with just paper and a pencil. There are countless items to use when creating graphs. Consider trying some of these to represent data on various types of graphs:
- Sticky notes
- Blocks
- Stickers
- Stamps
- Cereal
- Students’ pictures
- Small toys like cars
- Beads
- Candy
- Counting bears
- Plastic chip counters
- Straws
- String
Also, check out these websites for more graphing ideas:
20 Graphing Activities For Kids That Really Raise the Bar – We Are Teachers
Graphing Activities and Probability Hands-On Fun for Kids
25 Creative Graphing Activities Kids Will Enjoy – Teaching Expertise
Create digital graphs: How Do I Use the New Create A Graph-NCES Kids’ Zone